arrow_back
Chart patterns
Double Bottom
event
Posted Jun 26, 2026
update
Updated Jun 26, 2026
A double bottom is a bullish reversal pattern that forms after a downtrend. Price hits a low, bounces, pulls back to the same low level, then reverses upward.
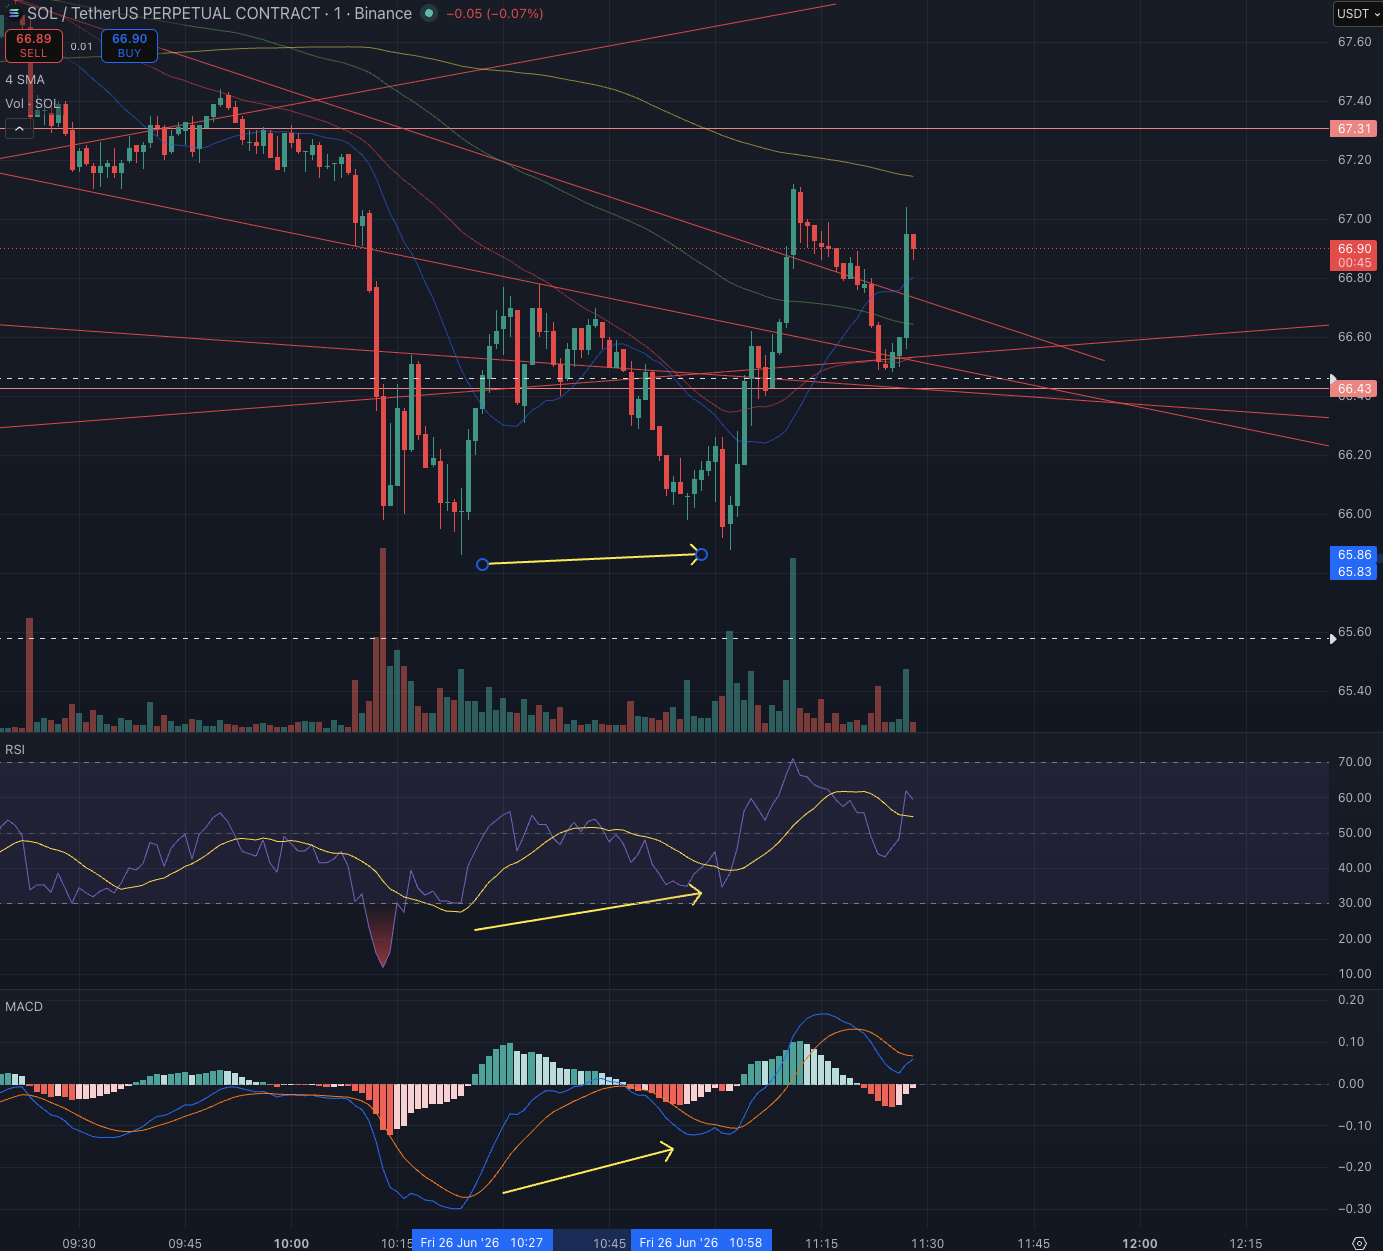
Now Your SOL 1m Chart
Yes — there is a double bottom forming here. Your yellow arrows are pointing it out correctly.
What I see:
- First bottom — sharp drop to ~65.83 area around 10:15-10:20
- Bounce — price recovers to ~66.43-66.50 area (your dashed line — the neckline)
- Second bottom — price retests ~65.83-65.86 around 10:45-10:58
- Recovery — strong green candle back up through 66.43
Indicator Confluence — This Is Strong
Your yellow arrows are also showing something important:
RSI divergence:
- First bottom — RSI spiked down to ~15 (extremely oversold)
- Second bottom — RSI only reached ~30 despite price being at the same level
- Higher RSI on same price low = bullish divergence — sellers are weakening
MACD divergence:
- First bottom — MACD deeply negative (~-0.20)
- Second bottom — MACD less negative despite same price
- Same pattern — momentum divergence confirming the double bottom