arrow_back
Chart patterns
Falling Wedge Breakout
event
Posted Jun 9, 2026
update
Updated Jul 16, 2026
sellBreakout
sellbullish
sellwedge
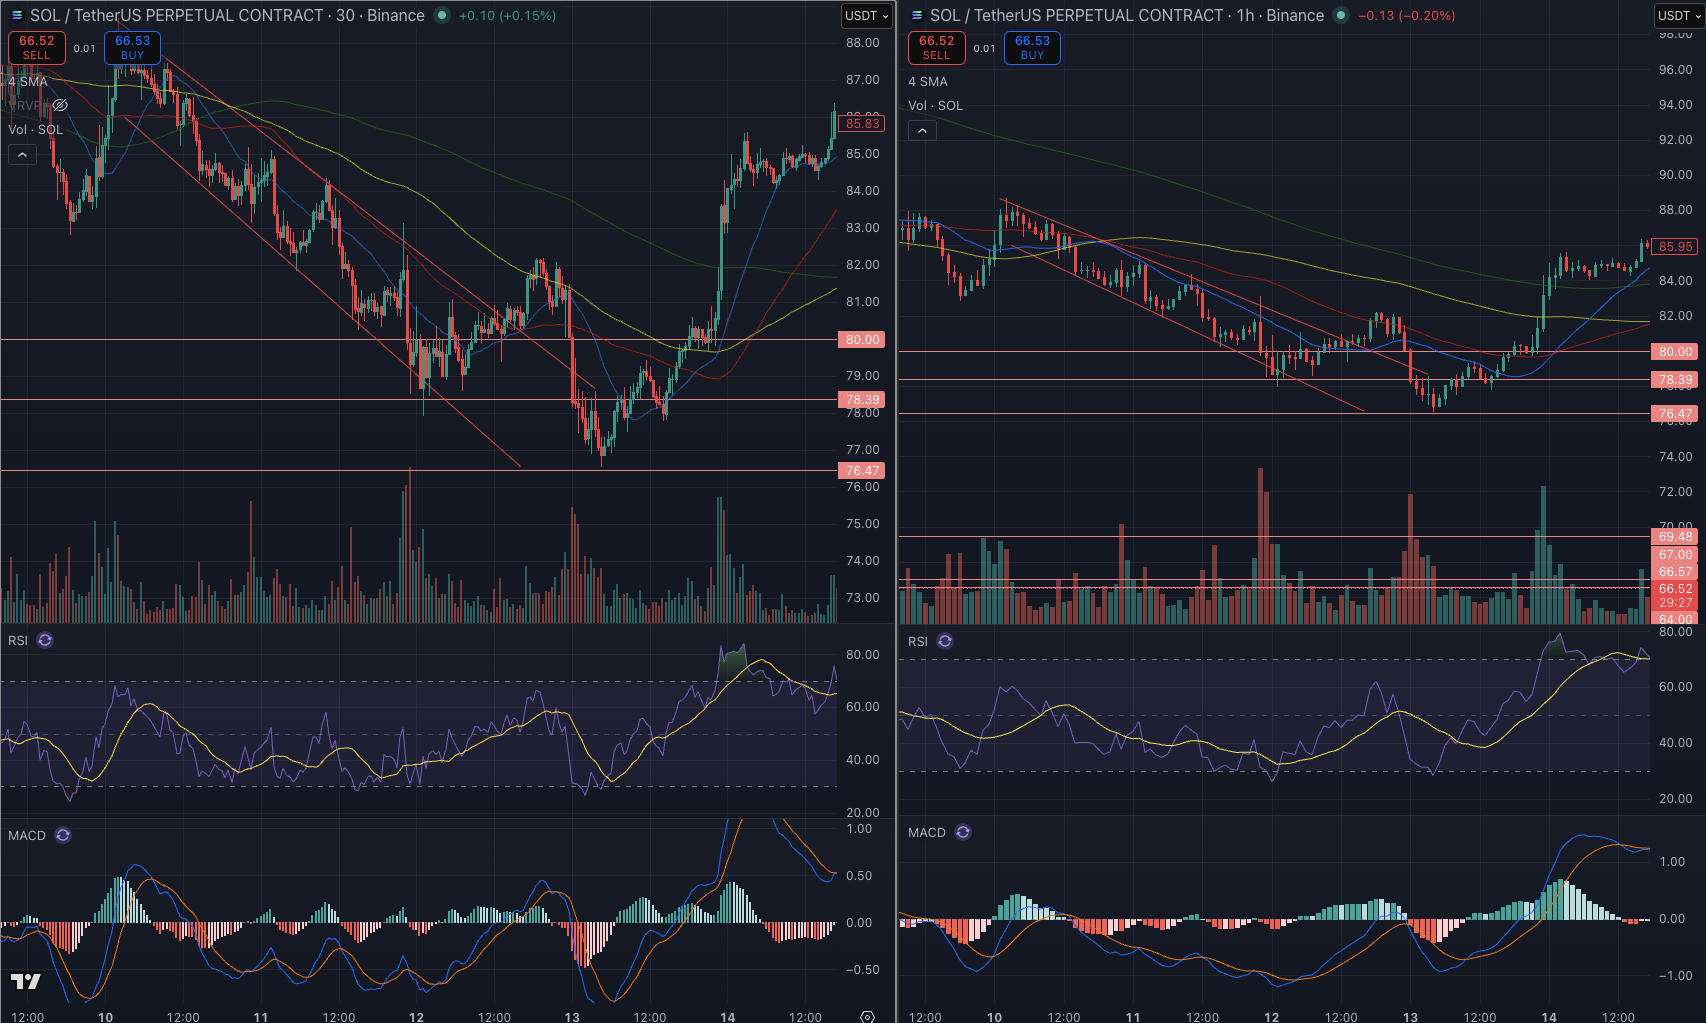
Identifying the Pattern: Falling Wedge
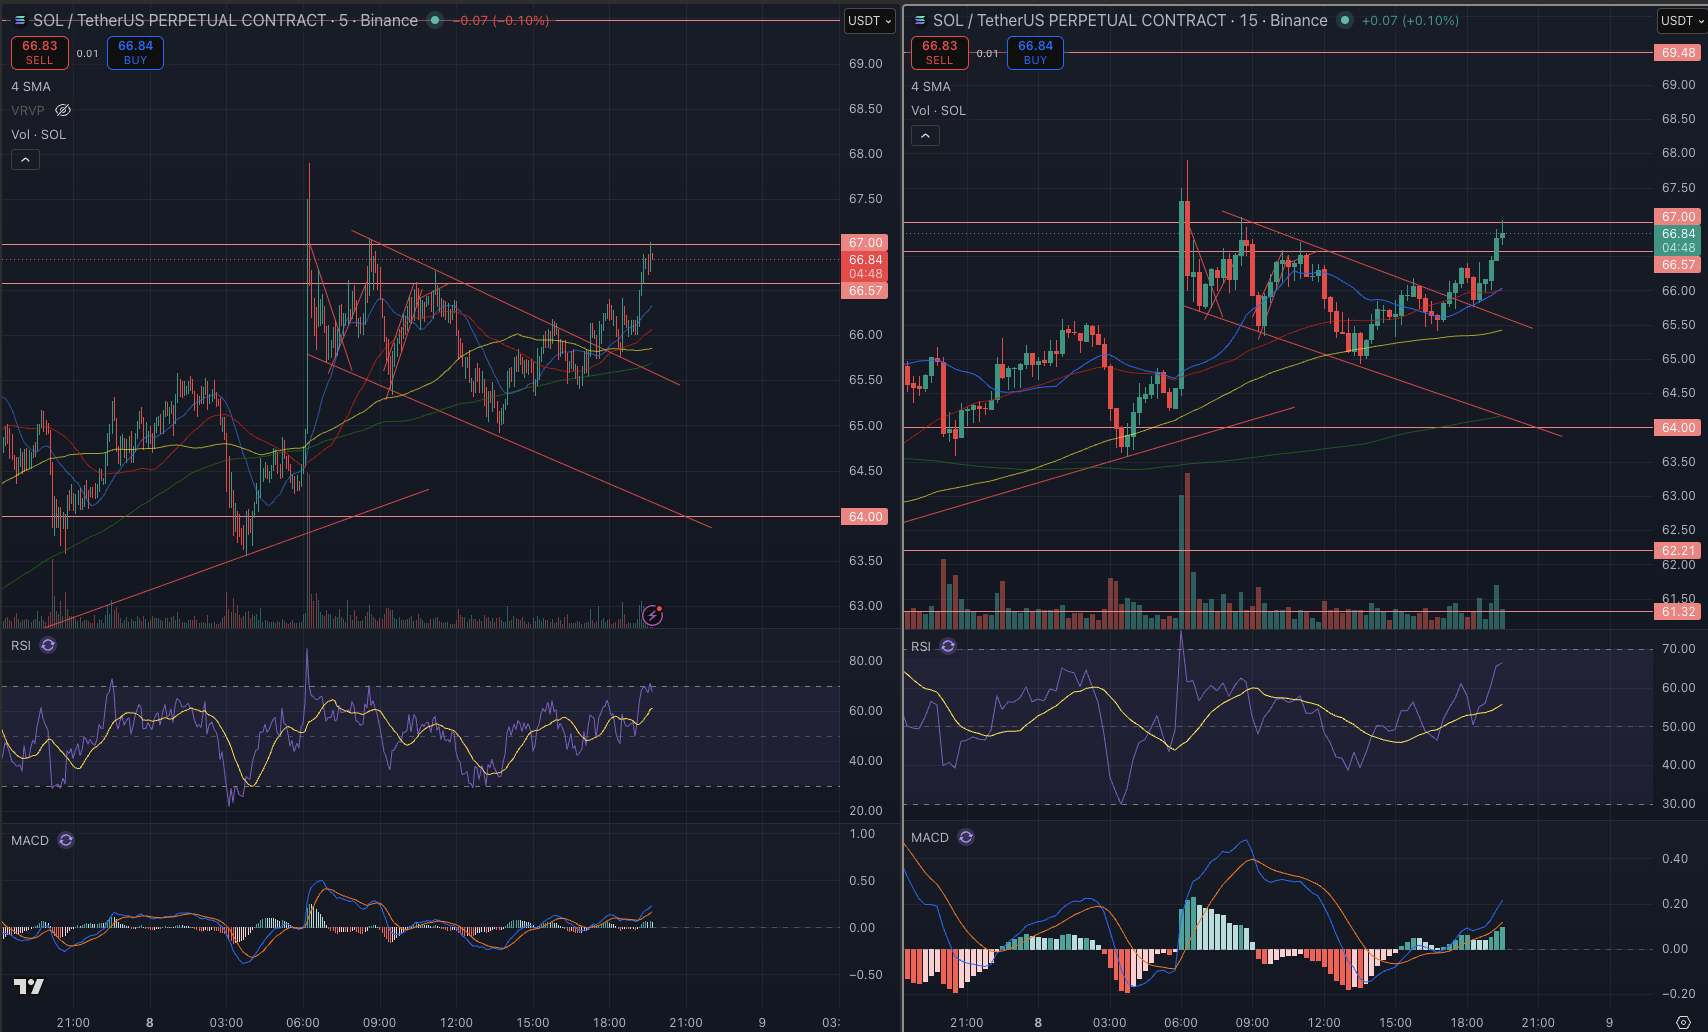
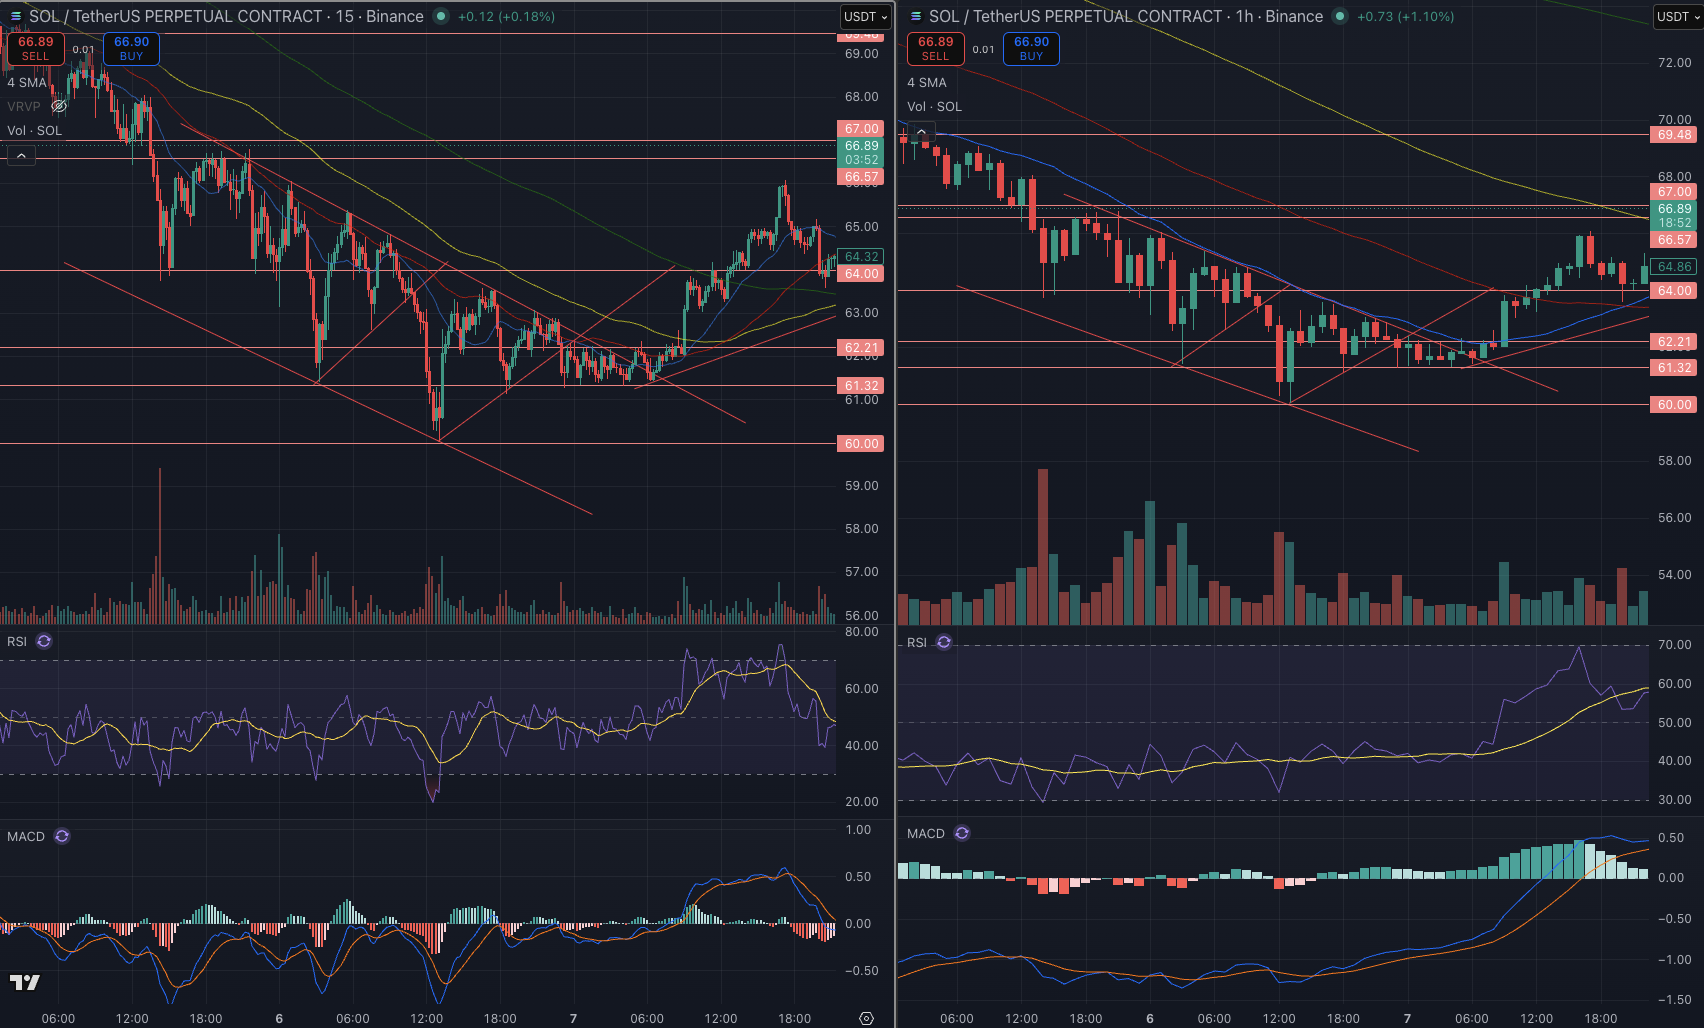
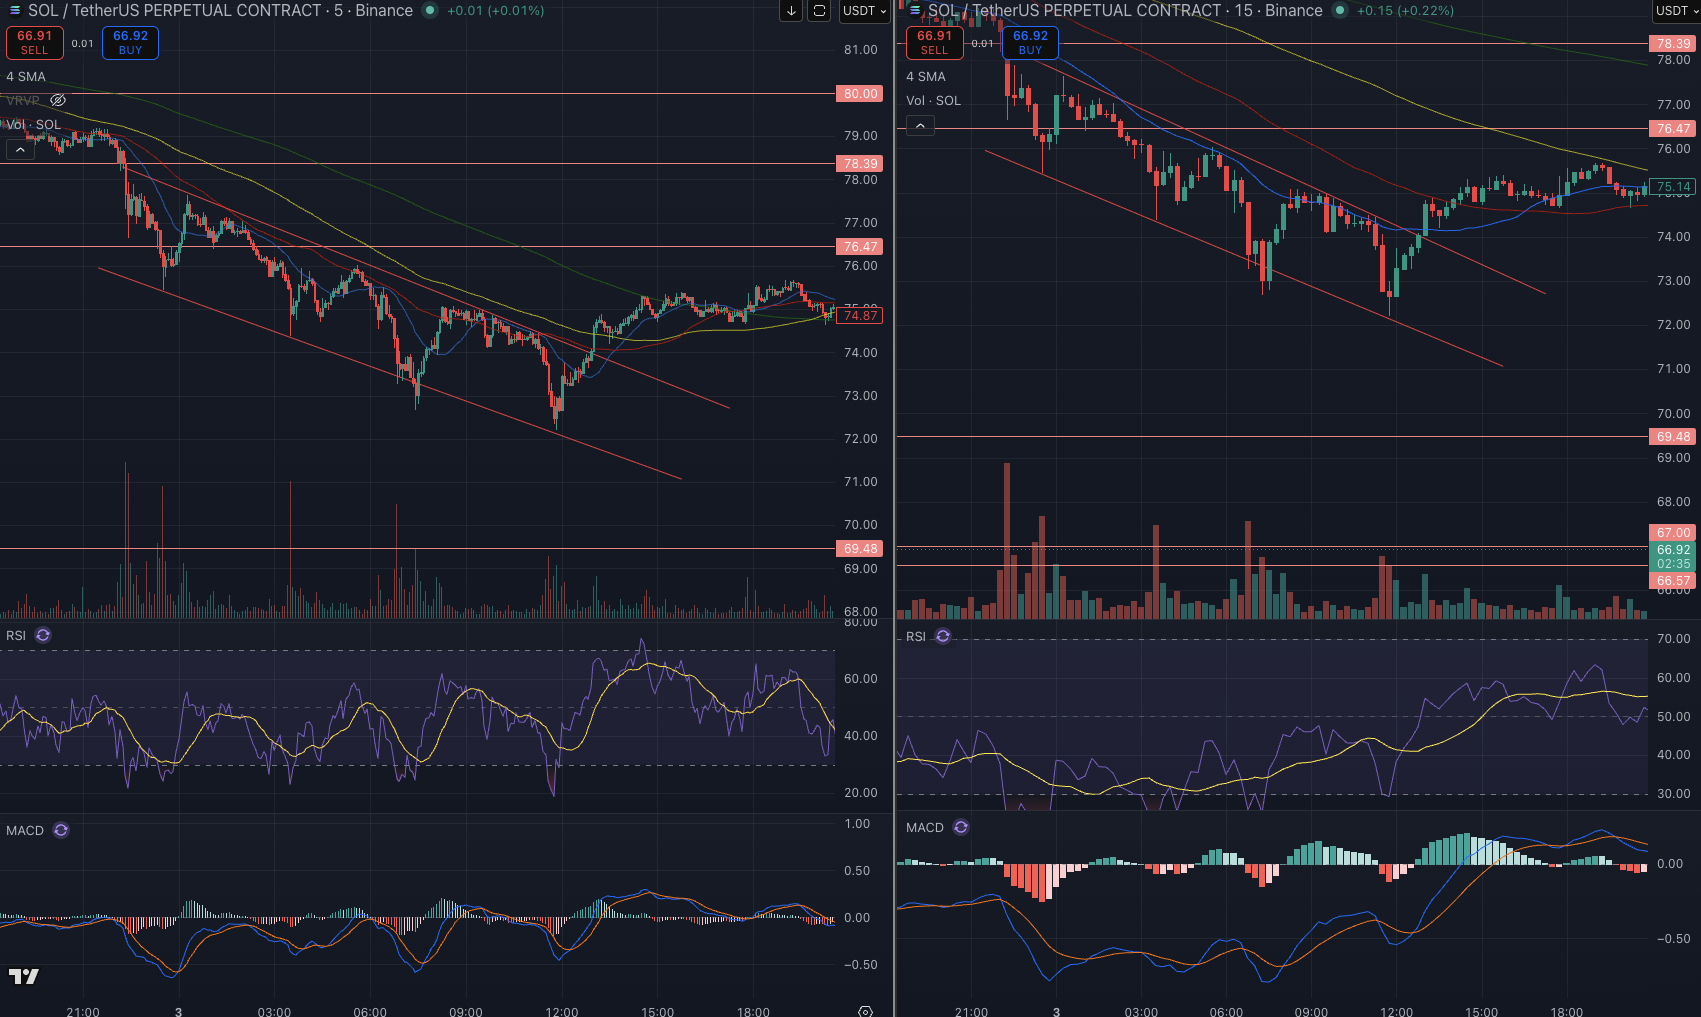
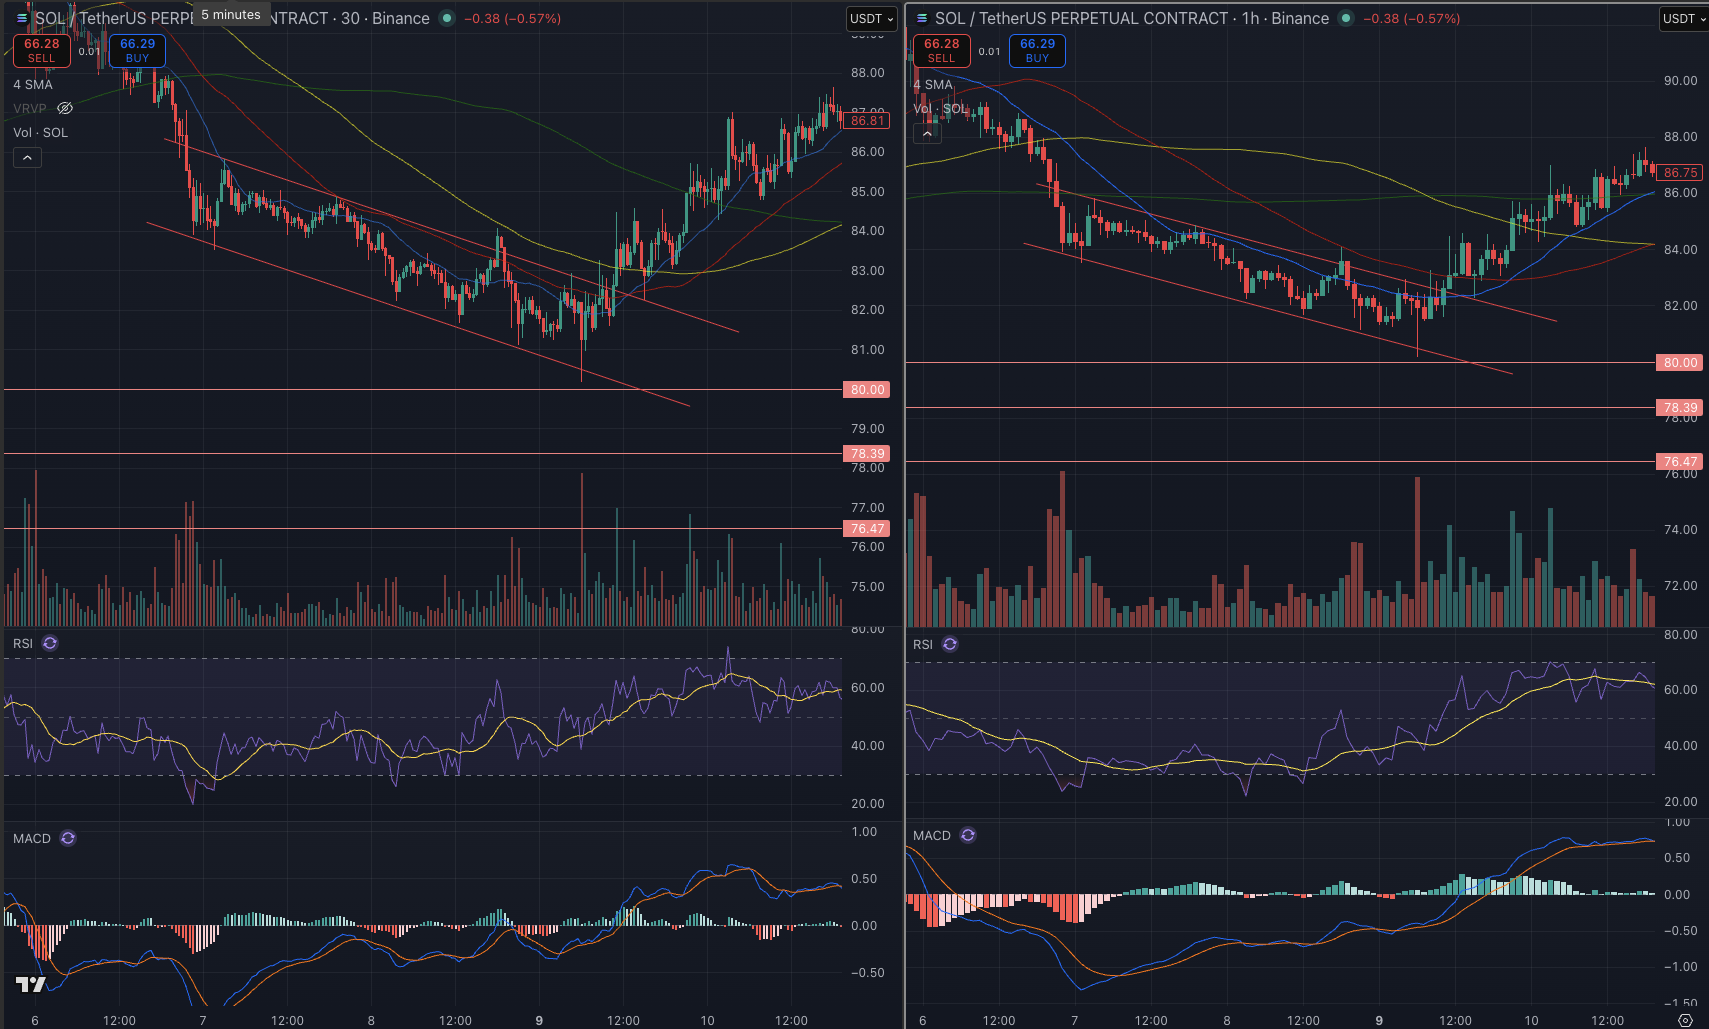
A falling wedge is characterized by two converging, downward-sloping trendlines:
- The Resistance Line (Top): Connects lower highs.
- The Support Line (Bottom): Connects lower lows.
Because the resistance line slopes downward at a steeper angle than the support line, the price gets "squeezed" into a tight apex. In technical analysis, this indicates that while sellers are still pushing the price down, their momentum is fading. It is structurally a bullish reversal pattern.
Plan
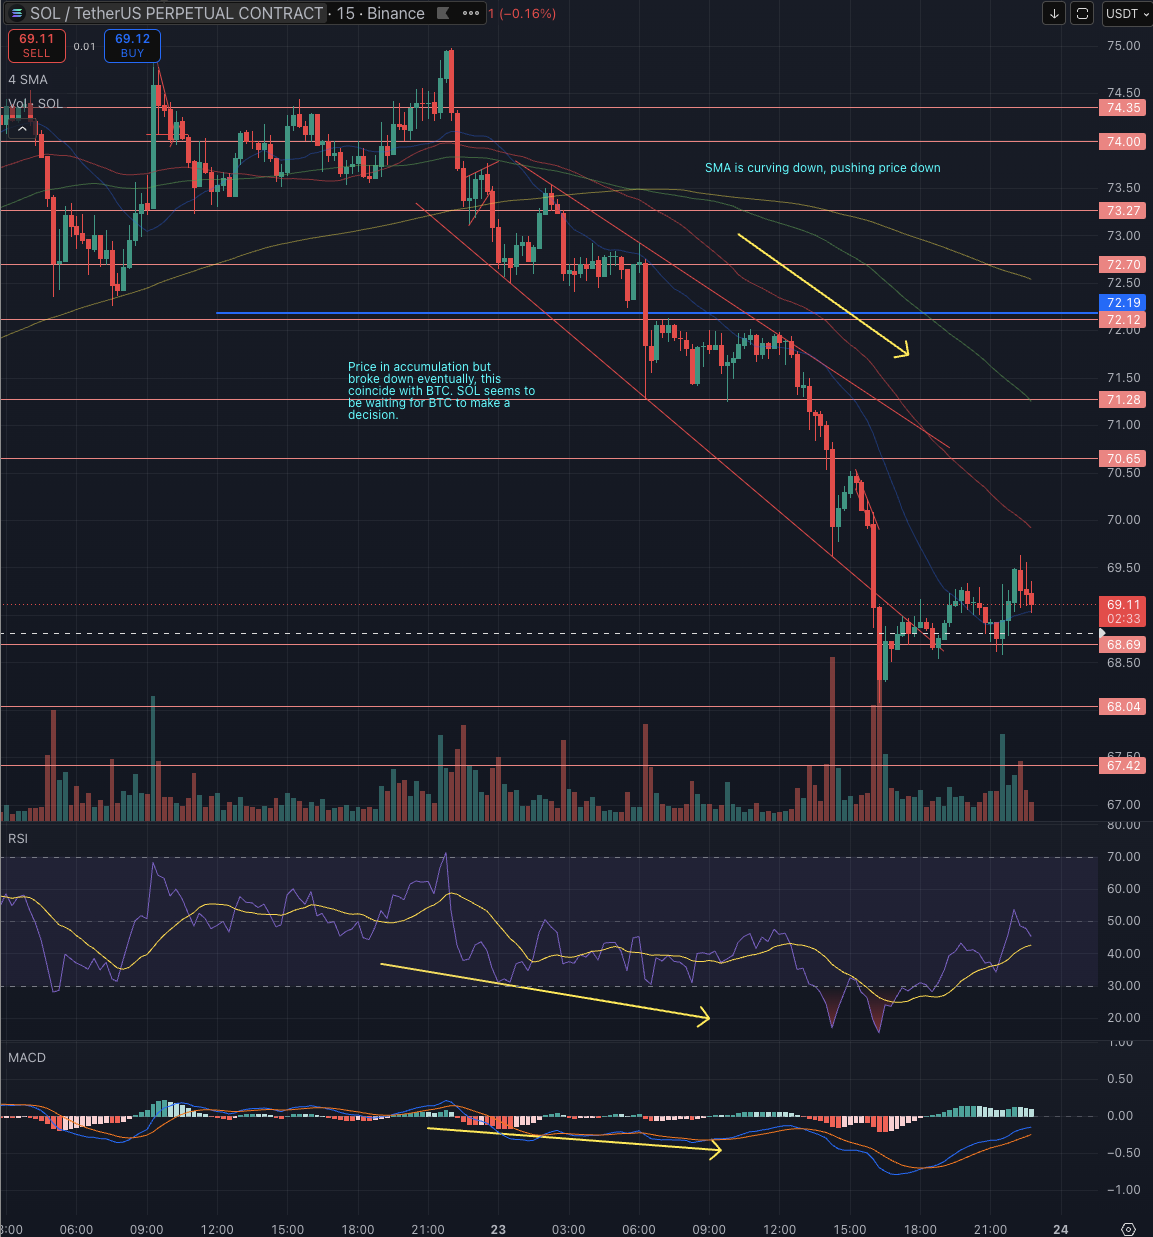
- Identify the price has making LH, LL.
- Observe MACD and RSI. Both should inclining slowly
- All SMAs will get compressed
- Observe SMA, when the price ready to get out of the wedge, the price will climb and above them.
- The breakout usually will go quite high, so set TP accordingly based on the resistance.